Definition/Introduction
To make clinical decisions and guide patient care, providers must comprehend the likelihood of a patient having a disease, combining an understanding of pretest probability and diagnostic assessments.[1] Diagnostic tools are routinely utilized in healthcare settings to determine treatment methods; however, many of these tools are subject to error.
Issues of Concern
Benefits of Diagnostic Testing
The utilization of diagnostic tests in patient care settings must be guided by evidence. Unfortunately, many order tests without considering the evidence to support them.[1] Sensitivity and specificity are essential indicators of test accuracy and allow healthcare providers to determine the appropriateness of the diagnostic tool.[2] Providers should utilize diagnostic tests with the proper level of confidence in the results derived from known sensitivity, specificity, positive predictive values (PPV), negative predictive values (NPV), positive likelihood ratios, and negative likelihood ratios.[2]
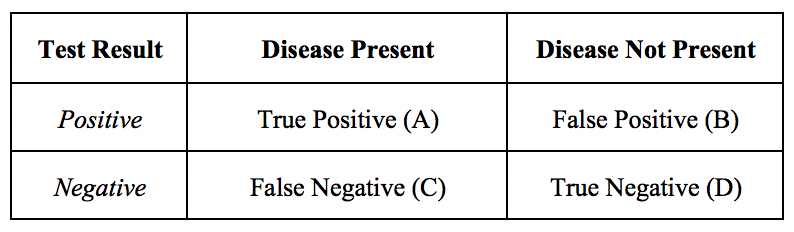
The presentation of diagnostic exam results is often in 2x2 tables. The values within this table can help to determine sensitivity, specificity, predictive values, and likelihood ratios. A diagnostic test’s validity, or its ability to measure what it is intended to, is determined by sensitivity and specificity.[3] See Table. Diagnostic Testing Accuracy Table.
Sensitivity
Sensitivity is the proportion of true positives tests out of all patients with a condition.[4] In other words, it is the ability of a test or instrument to yield a positive result for a subject that has that disease.[2] The ability to correctly classify a test is essential, and the equation for sensitivity is the following:
Sensitivity=(True Positives (A))/(True Positives (A)+False Negatives (C))
Sensitivity does not allow providers to understand individuals who tested positive but did not have the disease.[5] False positives are a consideration through measurements of specificity and PPV.
Specificity
Specificity is the percentage of true negatives out of all subjects who do not have a disease or condition [4]. In other words, it is the ability of the test or instrument to obtain normal range or negative results for a person who does not have a disease.[2] The formula to determine specificity is the following:
Specificity=(True Negatives (D))/(True Negatives (D)+False Positives (B))
Sensitivity and specificity are inversely related: as sensitivity increases, specificity tends to decrease, and vice versa.[3][6] Highly sensitive tests will lead to positive findings for patients with a disease, whereas highly specific tests will show patients without a finding having no disease.[6] Sensitivity and specificity should always merit consideration together to provide a holistic picture of a diagnostic test.[7] Next, it is important to understand PPVs and NPVs.
PPV and NPV
PPVs determine, out of all of the positive findings, how many are true positives; NPVs determine, out of all of the negative findings, how many are true negatives. As the value increases toward 100, it approaches a ‘gold standard.’[3] The formulas for PPV and NPV are below.
Positive Predictive Value=(True Positives (A))/(True Positives (A)+False Positives (B))
Negative Predictive Value=(True Negatives (D))/(True Negatives (D)+False Negatives(C))
Disease prevalence in a population affects PPV and NPV. When a disease is highly prevalent, the test is better at ‘ruling in' the disease and worse at ‘ruling it out.’[1] Therefore, disease prevalence should also merit consideration when providers examine their diagnostic test metrics or interpret these values from other providers or researchers. Providers should consider the sample when reviewing research that presents these values and understand that the values within their population may differ.[5] Considering all of the diagnostic test outputs, issues with results (e.g., very low specificity) may make clinicians reconsider clinical acceptability, and alternative diagnostic methods or tests should be considered.[8]
Likelihood Ratios
Likelihood ratios (LRs) represent another statistical tool to understand diagnostic tests. LRs allow providers to determine how much the utilization of a particular test will alter the probability.[4] A positive likelihood ratio, or LR+, is the “probability that a positive test would be expected in a patient divided by the probability that a positive test would be expected in a patient without a disease.”.[4] In other words, an LR+ is the true positivity rate divided by the false positivity rate [3]. A negative likelihood ratio or LR-, is “the probability of a patient testing negative who has a disease divided by the probability of a patient testing negative who does not have a disease.”.[4] Unlike predictive values, and similar to sensitivity and specificity, likelihood ratios are not impacted by disease prevalence.[9] The formulas for the likelihood ratios are below.
Positive Likelihood Ratio=Sensitivity/(1-Specificity)
Negative Likelihood Ratio=(1- Sensitivity)/Specificity
Now that these topics have been covered completely, the application exercise will calculate sensitivity, specificity, predictive values, and likelihood ratios.
Application Exercise
Example: A healthcare provider utilizes a blood test to determine whether or not patients will have a disease.
The results are the following:
- A total of 1,000 individuals had their blood tested.
- Four hundred twenty-seven individuals had positive findings, and 573 individuals had negative findings.
- Out of the 427 individuals who had positive findings, 369 of them had the disease.
- Out of the 573 individuals who had negative findings, 558 did not have the disease.
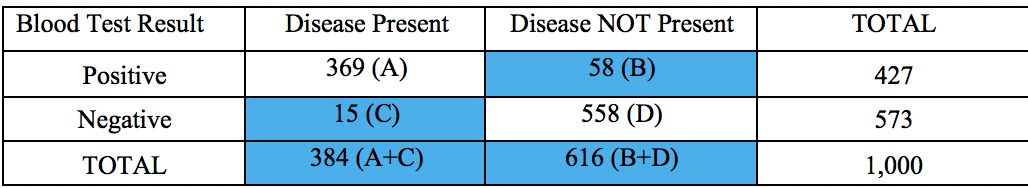
Let’s calculate the sensitivity, specificity, PPV, NPV, LR+, and LR-. We first can start with a 2X2 Table. The information above allows us to enter the values in the table below. Notice that values in blue cells were not provided, but we can get them based on the numbers above and the utilization of total cells. See Image. Diagnostic Testing Accuracy Table 2.
The provider found that a total of 384 individuals actually had the disease, but how accurate was the blood test?
Results:
Sensitivity
- Sensitivity=(True Positives (A))/(True Positives (A)+False Negatives (C))
- Sensitivity=(369 (A))/(369(A)+15 (C))
- Sensitivity=369/384
- Sensitivity=0.961
Specificity
- Specificity=(True Negatives (D))/(True Negatives (D)+False Positives (B))
- Specificity=(558 (D))/(558(D)+58 (B))
- Specificity=558/616
- Specificity=0.906
Positive Predictive Value
- PPV =(True Positives (A))/(True Positives (A)+False Positives (B))
- PPV =(369 (A))/(369 (A)+58(B))
- PPV =369/427
- PPV =0.864
Negative Predictive Value
- NPV=(True Negatives (D))/(True Negatives (D)+False Negatives(C))
- NPV=(558(D))/(558 (D)+15(C))
- NPV=(558 )/573
- NPV=0.974
Positive Likelihood Ratio
- Positive Likelihood Ratio=Sensitivity/(1-Specificity)
- Positive Likelihood Ratio=0.961/(1-0.906)
- Positive Likelihood Ratio=0.961/0.094
- Positive Likelihood Ratio=10.22
- Negative Likelihood Ratio
- Negative Likelihood Ratio=(1- Sensitivity)/Specificity
- Negative Likelihood Ratio=(1- 0.961)/0.906
- Negative Likelihood Ratio=0.039/0.906
- Negative Likelihood Ratio=0.043
The results show a sensitivity of 96.1%, specificity of 90.6%, PPV of 86.4%, NPV of 97.4%, LR+ of 10.22, and LR- of 0.043.
Clinical Significance
Understanding that other diagnostic test data techniques do exist (e.g., receiver operating characteristic curves), the topics in this article represent essential starting points for healthcare providers. Diagnostic testing is a crucial component of evidence-based patient care. When determining whether or not to use a diagnostic test, providers should consider the benefits and risks of the test, as well as the diagnostic accuracy.[1] By having a foundational understanding of the interpretation of sensitivity, specificity, predictive values, and likelihood ratios, healthcare providers will understand outputs from current and new diagnostic assessments, aiding in decision-making and ultimately improving healthcare for patients.
Nursing, Allied Health, and Interprofessional Team Interventions
All interprofessional healthcare team members need to understand these values as applied to diagnostic testing, so they can better analyze a patient's condition based on testing results. Any lack of understanding in this area can lead to improper diagnostic interpretation leading to sub-optimal outcomes. Healthcare team members need to collaborate openly to facilitate proper diagnosis leading to properly targeted therapeutic interventions. [Level 5]